Temporal Analysis and Meso/Micro-Scale Climate Inputs
Duluth, MN -- Blog 3
-----------------------------------------------------------------------------------------------
Climate Classification
Koppen- Geiger System: "Dfb," Warm Summer Humid Continental Climate, with neither a dry summer or winter or without a warmest month above 22C, but at least four months above 10C.
(Link to view Koppen-Geiger Map: http://upload.wikimedia.org/wikipedia/commons/7/74/Koppen_World_Map.png)
(Link to view Koppen-Geiger Map: http://upload.wikimedia.org/wikipedia/commons/7/74/Koppen_World_Map.png)
 |
| Normals, Means, and Extremes from Duluth Harbor 1971-2000. Click image to expand. |
 |
| These climate graphs support the Koppen-Geiger Classification in that July and August temperatures average below 70F (this is not far below 22C, however) and there are at least 4 months above 50F (10C), May through September. Year-round precipitation also supports the classification. It is important to note that Duluth's geography brings conditions outside this rigid classification. Maritime temperate and maritime arctic are two examples. |
Meso and Micro-Scale Climate Inputs
Meso-Scale:
- Duluth's proximity to Lake Superior is the main meso-scale factor. A summer heat rises, cool lake air advects inland, cooling the city. Conversely, lake-effect/enhanced snow has brought in over 25" of snow over a 24-hour period.
Micro-Scale:
- Orographic Influence - Duluth is split between lake level and a western ridge; orographic lift is minor ( 600-800') but nonetheless impacts precipitation distibution.
 |
Orographic influence in Duluth. Seasonal snowfall totals on Duluth's western
ridge may receive 20" or more than portions of the city at lake level.
|
- Influence of Convergence - Air is funneled through Duluth, hindered by high terrain, it experiences directional convergence. This deflection focuses wind directly towards the harbor where contact with the land/water interface and increased friction slows its velocity. This frictional convergence compiles air movements as faster open-water air converges with the slower moving air over land. Increased lifting of air as a result of convergence is a snow-enhancing mechanism which helps to account for Duluth's high snowfall amounts.
 |
| Visualization of convergence at Duluth. Frictional Convergence is the left image, Directional Convergence is shown in the center. The image on the right is meant to convey a net effect. |
- Anthropogenic Factors - Minimal. Duluth is a busy port (by midwest standards) yet these diesel-burning ships would not impact the weather station much. However, placement by the lake would yield temperatures lower than those on the hill because of cooler summer and winter temperatures at lake level.
Duluth's Historical Climate
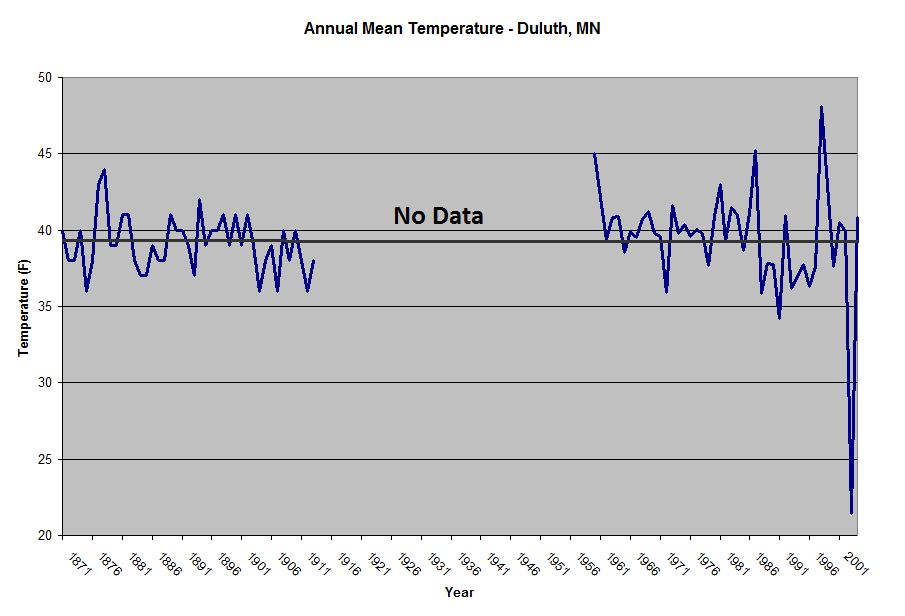 |
| Mean temperature graph for Duluth Harbor. Included data encompasses the years 1871-1913 and 1960-2004. Data could not be located for missing years. |
 |
| Total precipitation by year for Duluth Harbor. Included data encompasses the years 1871-1913 and 1960-1993. Data could not be located for missing years. |
Obeservation of the above trendlines in order to gauge climate change in Duluth, MN reveals a disparity:
- Temperature - The trend appears to have no slope/ no change over time. Yet, there is an actual dip in the line, which accounts for a minute change (39.30F to 39.26F). This neglible value (0.04F) is not evidence of apparent climate change. However, the fluctuations of peak to trough, shown by the extreme values, seems to increase in more recent years. This phenomenon could be a pattern of increasing occurence of extremes due to climate change or simply the result of more accurate measurements.
- Precipitation: There is a clear negative slope, suggesting a significant temporal reduction of precipitation from 1871-1993 of ~9". As with the temperature example, rain gaging has advanced over time, however, this graph shows an indication of climate change worthy of notice. Although Duluth is not an agricultural center, Minnesota surely is; a regional decline of precipitation could damage food production.
*This exercise highlights the importance of data in climatology work. One incomplete dataset simply does not cut it.
Sources:
Data:
Other Information:
*Some information retrieved from previous blogs.
No comments:
Post a Comment